
Understanding your Sledge Dashboard: revenue, growth intelligence, and live signals
The Dashboard is the first screen you see when you open Sledge, and it’s built to answer three questions in the order a merchant actually asks them: is Sledge making me money?, what should I do next?,
The Dashboard is the first screen you see when you open Sledge, and it’s built to answer three questions in the order a merchant actually asks them: is Sledge making me money?, what should I do next?, and what are customers doing right now?
It isn’t a report you need to study. Treat it as a weekly check-in — the numbers tell you whether things are working, and the cards below them tell you where to spend your next half hour.
Before you start — Sledge Core must be active on your theme, otherwise there’s nothing to measure and every panel stays empty. Figures here cover Sledge-attributed activity only, so they will always be smaller than your total Shopify numbers.
Revenue and the headline metrics
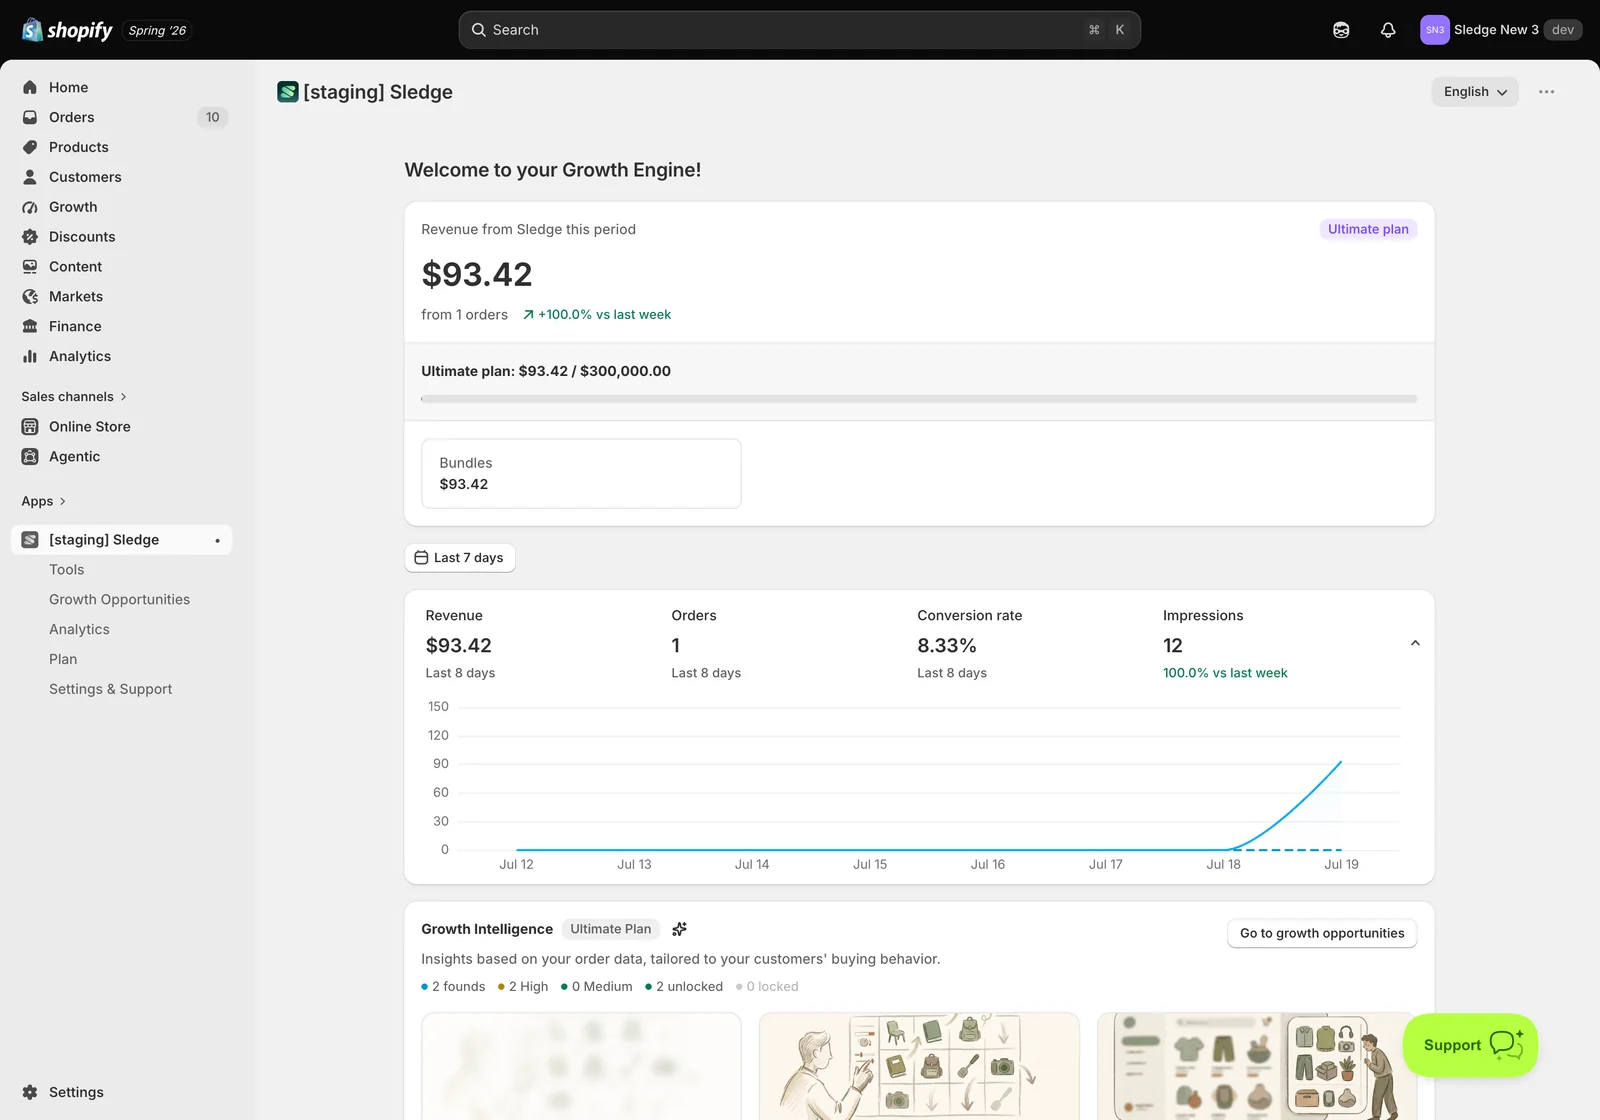
At the top, Revenue from Sledge this period shows what Sledge has earned, the number of orders behind it, and the change against the previous week. If your plan carries a revenue allowance, the bar underneath shows how much of it you’ve used.
Below that, a date selector (for example Last 7 days) controls four headline metrics:
- Revenue — money from orders Sledge contributed to.
- Orders — how many of those orders there were.
- Conversion rate — the share of sessions that became orders.
- Impressions — how often your Sledge widgets were actually seen.
Read Impressions together with Revenue. High impressions with low revenue means customers are seeing your widgets but not acting on them — an offer or placement problem. Low impressions means they’re barely being seen at all, which is usually a coverage problem: not enough surfaces switched on.
Growth Intelligence — what Sledge thinks you should fix
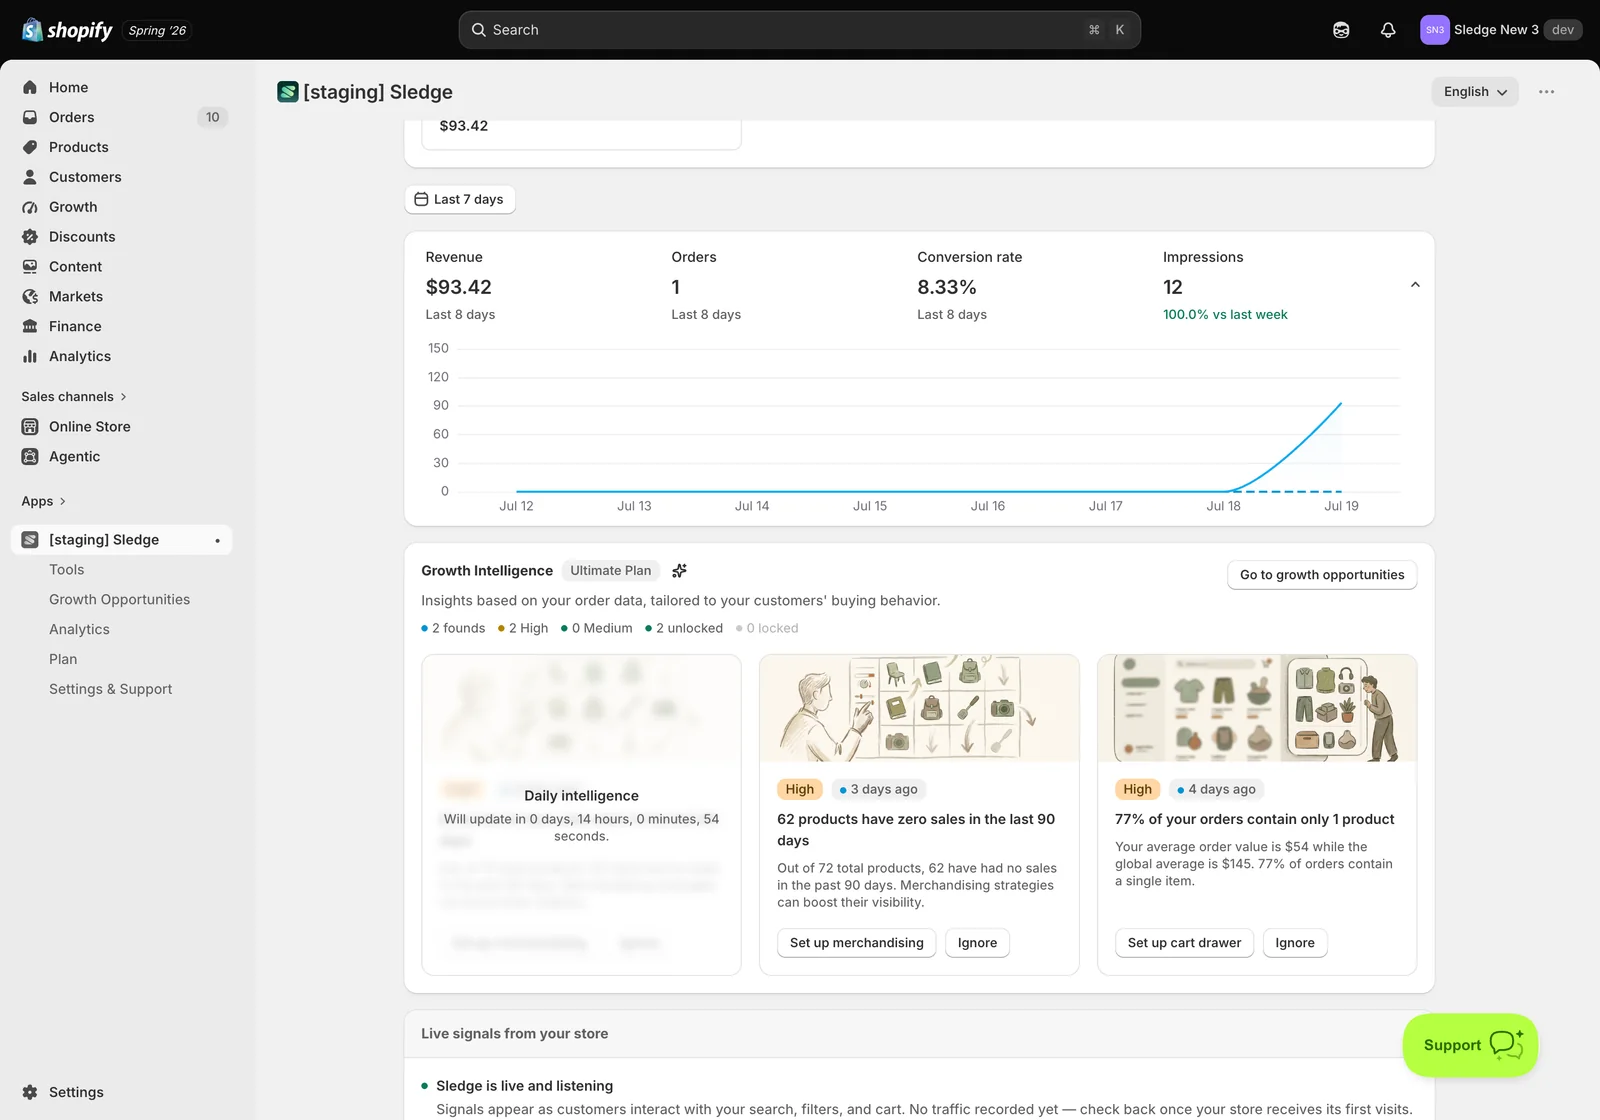
This is the part worth reading properly. Sledge studies your own order data and raises findings written as plain observations about your store, not generic advice.
The counters summarise what it found: how many findings there are, how many are High or Medium priority, and how many are unlocked versus locked on your plan. Daily intelligence shows the countdown to the next refresh.
Each finding card carries a priority tag, when it was raised, the observation itself, and two actions. Real examples from this store:
- “62 products have zero sales in the last 90 days” — out of 72 products, 62 have never sold. The suggested fix is merchandising, to give those products visibility. The card’s button is Set up merchandising.
- “77% of your orders contain only 1 product” — average order value is $54 against a global average of $145. The button here is Set up cart drawer, because that’s where you add a second item to a basket.
The button takes you straight to the feature that addresses it, so the finding and its fix are one click apart. Ignore dismisses a finding you’ve considered and decided against — use it, because a tidy list keeps the remaining findings meaningful.
Go to growth opportunities opens the full playbook, where these findings sit alongside the complete set of best practices.
Live signals from your store
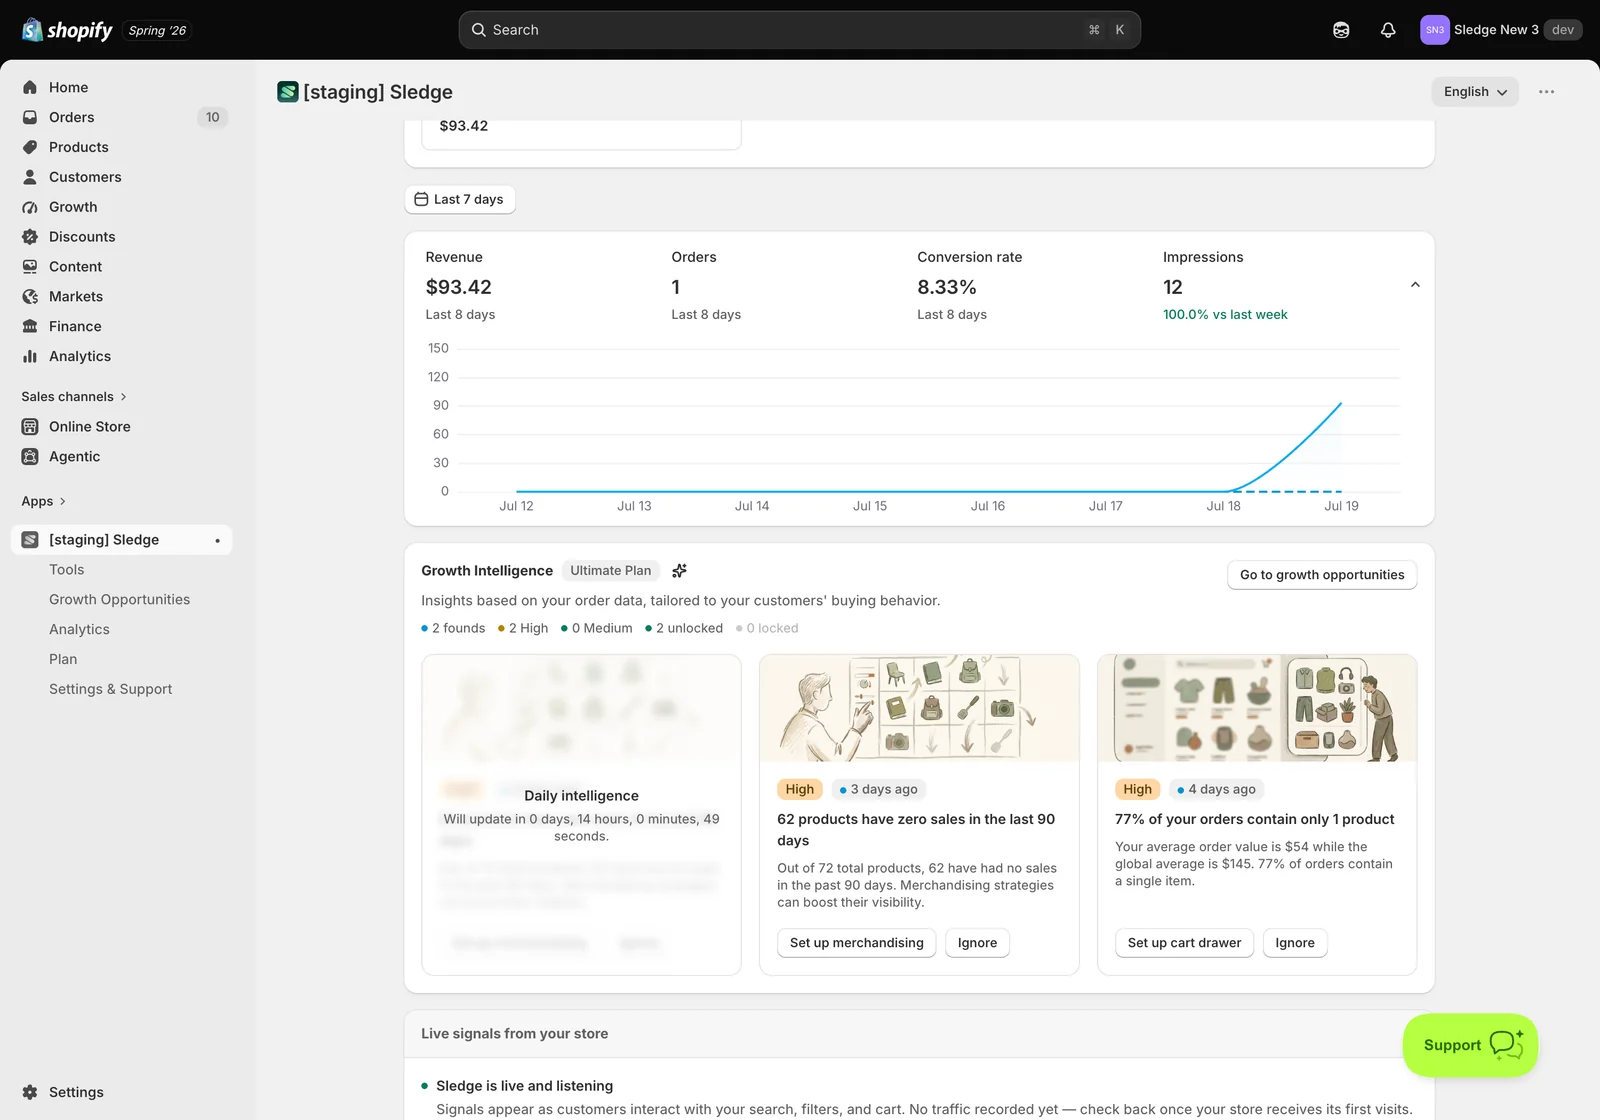
The last panel reports what customers are doing right now — searches, filters, cart activity as they happen.
On a new or quiet store it reads “Sledge is live and listening” with a note that signals appear once customers interact with your search, filters, and cart. That message is a healthy state, not an error: it confirms Sledge is connected and waiting for traffic. Signals need real visits before they can show anything, and they need widgets on the surfaces customers actually use — if search and filtering aren’t switched on, there is nothing for Sledge to listen to.
How to use the Dashboard week to week
- Check Revenue and the trend arrow. Rising is good; flat with high impressions means your offers need work.
- Read any High priority finding under Growth Intelligence and act on one of them.
- Use the finding’s button rather than hunting for the setting yourself — it lands you in the right place.
- Ignore anything that genuinely doesn’t apply to your store, so the list stays honest.
- Open Analytics when you want the detail behind a number, and Growth Opportunities when you want the full checklist rather than the top few findings.
Everything showing zero? Check that Sledge Core is enabled on your published theme and that at least one feature is switched on under Tools — Sledge can only report on surfaces where it’s actually running. A brand-new store also needs traffic before any panel fills in, and orders can take a few minutes to appear. If findings look thin, that’s expected early on: Growth Intelligence reads your order history, so it gets sharper as orders accumulate.
Related
- How to Enable Sledge Core and Complete the Initial Setup ?
- Growth Opportunities by Goals: working through the playbook outcome by outcome
- Growth Opportunities by Customer Journey: fixing your store stage by stage
- How do I set up Instant Search?
- How do I set up Best Seller recommendations?
- How do I set up a filter group?
Last updated on